In this lesson we are going to learn about the 5 day SMA:
- What are the best uses for the 5-day SMA?
- In what type of market does it work best?
- When does it not work?
- What are the dangers?
- What are some business examples?
The 5-day SMA is used as a tool or indicator for many traders based on discretionary rules. The 5-day SMA does not work well as a stand-alone indicator, but it can be very useful in conjunction with other technical indicators for day-end entries, exits, and stops.
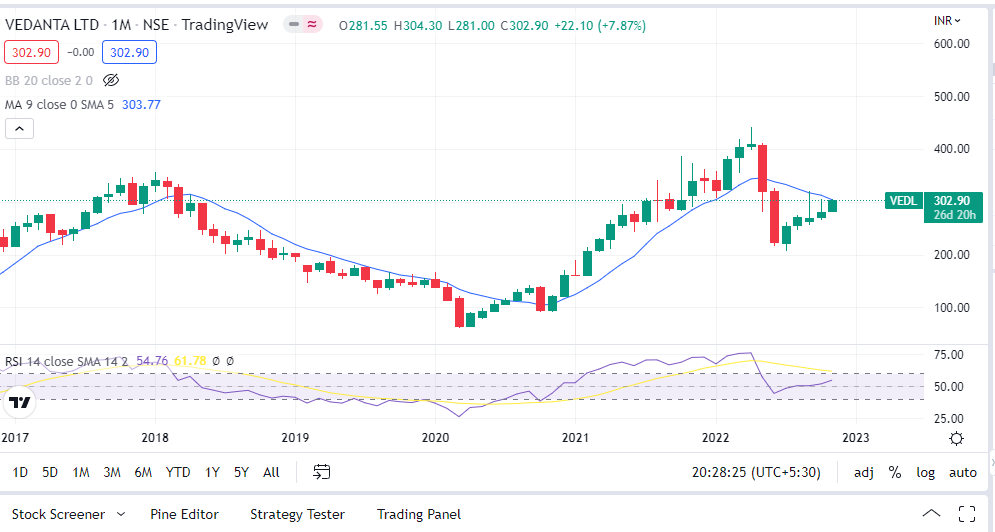
Chart Courtesy: Tradingview
Uses of 5 Day SMA
- A short-term momentum long indicator to capture a few days of a trend if the price breaks above it.
- If the price suddenly breaks above it after weeks of being below it.
- This can be an indicator of a short position if you lose after trading above the price for weeks.
- Can be used in conjunction with RSI for inputs and outputs. Avoid long entries in overbought markets or short positions in oversold markets. Trading vehicles will vary, so you will need to study the charts in your markets to see what RSI levels have been helpful historically.
- It will show you the short-term trend on a daily time frame based on which side the price is on, up and down.
- This can be used at the end of the day after entering the long-term moving average signal. Enter using the 200-day SMA, and if the trade is in your favor, exit after the 5-day SMA is lost and lock in the profit, and don’t take it back until the end of the day.
- This can be a trailing stop because it allows profits to be delayed in the entered trend based on a different type of entry signal. For example, You can enter late in the day after a break above the 200-day SMA and a close below the 200-day SMA. Then, if the price breaks above the 50-day SMA, close your stop below the 50-day SMA. Then to the 10-day SMA and finally the 5-day SMA close low
SMA day. You can lock in profits and trade back into the 200-day SMA with no loss, but you can exit and in profits. - The 5-day exponential moving average is a tool to gain strong momentum during a 5-10 day trading period. It is best used in conjunction with a strong bullish candlestick, a breakout of a major long-term moving average, or a trading range breakout.
Following a downtrend in the oversold area, a sharp reversal at the 5-day SMA could signal a long reversal in momentum as it closes at a key long-term moving average. In a downtrend, the 5-day SMA could act as a resistance at the end of the day. The 5-day SMA is a great way to stop a winning trade after taking a short position on a stock, missing the 200-day moving average, and starting a downtrend on a major release.
Where Not to Use
The 5-day SMA is not useful in markets that are stuck in a trading range, trendless, or entering the 5-day SMA every day. The trading range expansion is due to uncertainty in direction and does not honor the 5-day SMA as price discovery is ongoing.
Where to Use 5 Day SMA
- Following a momentum signal such as a break above a major trading range, a very bullish candlestick, a gap and go, or a break and above a major long-term moving average such as a 50-day or 200-day.
- The 5-day SMA moving average is an excellent short-term moving average to use in the moving average crossover strategy system.
- You want to use the 5-day SMA on charts where the price stays on one side of the 5-day SMA line for several days and weeks. This shows that it is being respected, and being on one side for a long time suggests a strong accumulation or distribution in the market.
- Keep in mind that the best time frame to trade a 5-day SMA is only 5-10 days in most cases. Taking profit is important because the price moves much higher than the 5-day SMA as it usually goes back to that line, and trends that are strong don’t last for a few weeks to a month. The best way out is to use oscillators that show overbought or oversold conditions or Bollinger Bands.
What is 5 SMA?
5 SMA is also called 5 days SMA. It means that the 5 number of prices within a time period is divided by the number of total periods. Suppose, TCS closed at 3000, 2900, 3000, 3100, 3000 on last five trading sessions. Them 5 days SMA would be Total sum/5. i.e. 15000/5= 3000.