RSI is a momentum indicator used that is used in technical analysis. RSI value is displayed on the line graph on a scale of 0 to 100. RSI value can tell us the reversal and buying opportunities in the market. Traditionally, the market is said to be overbought if it is above 70 and oversold if it is below 30.
But, here I would like to discuss a different strategy of RSI which I found useful. I have learned it from Youtube and wanted to discuss it with you same.
*Disclaimer: We are posting the strategies for educational purposes only. Kindly do not trade on the basis of my analysis. I am not SEBI register. Kindly plan your trade as per your financial advisor.
Let us discuss step by step with examples and screenshots:
RSI Strategy
In this RSI strategy, if the RSI value is above 60 then it is considered an uptrend if the RSI value is between 40-60, then it is considered a sideways market and if the RSI value is below 40, then it is considered as a bearish market. It works on all time frames but follows the higher time frames. Multi-time frame analysis is necessary for getting a better trade.
First of all, there are some rules that need to be followed.
- Always check the higher time frame first. For example, If you wanted to do trade or investment on a daily chart, then you need to check the Weekly and Monthly RSI values. Similarly, if we wanted to trade 5 minutes chart, then check for 15 minutes and hourly time frames.
- Check which sector is having momentum and which sector is performing low. Accordingly, you can plan your trade.
- Then buy or sell as per levels of support and resistance.
If you follow these steps, then your probability of winning the trade gets increases. We will take one example of a buy trade on 5 minutes chart and one sell trade on 5 minutes chart.
RSI Strategy for Buy Trade
Suppose, we wanted to trade in Nifty 50 on 5 minutes chart. We are looking for a buying opportunity. Then, follow the steps before taking a trade.
- First, check whether the market is in an uptrend trend.
- As we are going to trade on Nifty 50 on 5 minutes chart, so, we will check the higher time frame for buying opportunity.
- The hourly and 15 minutes RSI value should be above 60 and the RSI value on 5 minutes chart should be taking support from the value of 40.
- Before buying, check the price action also for better chances of winning the trade.
Let us understand it by an example:
Nifty 50 Hourly Chart

- The below chart is of Nifty 50 index hourly chart. As we can see, the Nifty 50 is bullish on the hourly chart having RSI value more than 60 and marked as red rectangle.
Nifty 50 15 minutes chart
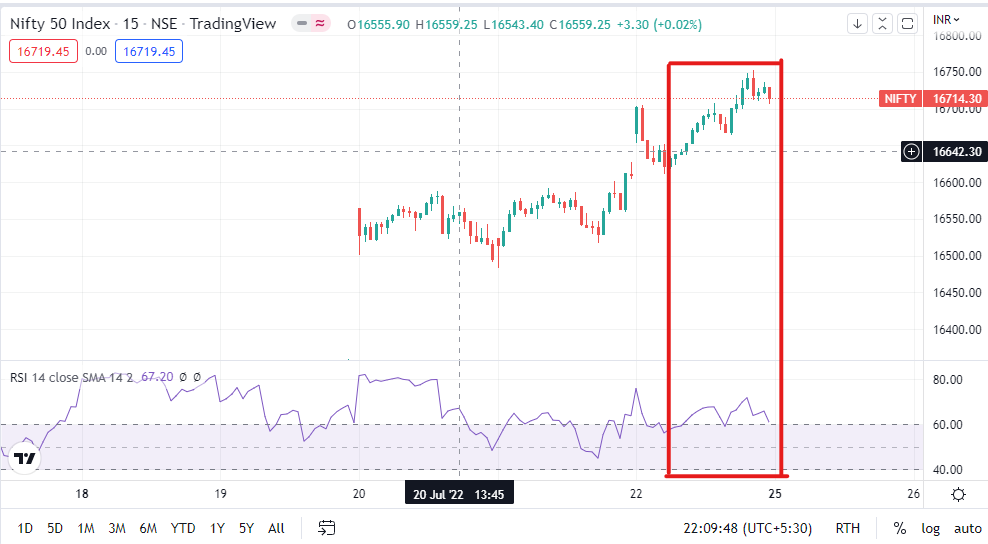
- The above chart is of Nifty 50 index is on 15 minutes chart. As we can see, the Nifty 50 is bullish on the 15 minutes chart having RSI value above 60 and marked as red rectangle.
Nifty 50 5 minutes chart
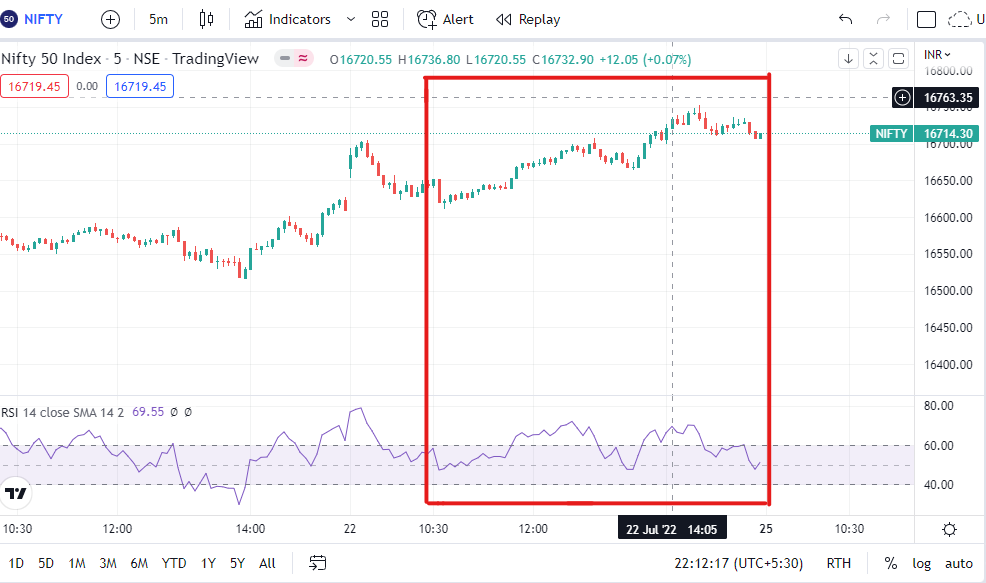
- So, if we take a trade near RSI value 40 on 5 minutes chart, then we can see that there is an uptrend beginning on 5 minutes chart and can book profit when there is price action and the value of RSI falls below 60 or as per risk reward ratio.
-Chart Courtesy Tradingview.com
*Always use stop loss while trading or it is your own choice.
RSI Strategy for Sell Trade
Suppose, we wanted to trade in Nifty 50 on 5 minutes chart. We are looking for a selling opportunity. Then, follow the steps before taking a trade.
- First, check whether the market is in a downward trend.
- As we are going to trade on Nifty 50 on 5 minutes chart, so, we will check the higher time frame for selling opportunity.
- The hourly and 15 minutes RSI value should be below 40 and the RSI value on 5 minutes chart should be taking resistance from the value of 60.
- Before selling, check the price action also for better chances of winning the trade.
*Always use stop loss while trading or it is your own choice.
I hope, you find this strategy useful, and let me know in the comments if you have any questions.
Follow us on Twitter
Also, check Market Predictions
*Disclaimer: We are posting the strategies for educational purposes only. Kindly do not trade on the basis of my analysis. I am not SEBI register. Kindly plan your trade as per your financial advisor.
What does the RSI tell you?
RSI tells the strength of the market whether it is an uptrend, sideways, or downtrend. It is a momentum indicator that is used by most of traders and investors.
What is RSI Indicator?
RSI tells the strength of the market whether it is an uptrend, sideways, or downtrend. It is a momentum indicator that is used by most of traders and investors.