
What are SUPPORT AND RESISTANCE?
Support and resistance are those levels in the stock market or price points in a chart, at which Buyers or Sellers are most active.
Support and Resistance are called S & R in short.
The support Price is the price point of the chart, from where the number of Buyers is likely to be more than the Seller, and hence the stock price is likely to go up when the price of the particular stock reaches that level.
On the other side, Resistance is the price point of the price chart, from where the number of Sellers is likely to be more than the Buyers, and hence the stock price is likely to go down when the price of the particular stock reaches that level.
USE OF SUPPORT AND RESISTANCE
We get to know the following three things from the support and resistance levels.
- Entry Point- When to enter a trade, that is, at what price to buy the share,
- Exit Point – When to sell in a trade or book a stop loss.
- Target– How much profit can be taken from a trade.
If you learn to identify support and resistance in a chart, you can very easily identify the price of a stock, from where the stock moves either up, or from where the stock price goes down. In this way, you also understand that from where the price of the stock is going to go up, that should be your entry point, and from where the price of the stock is going to fall, that will be your exit point, and thus you can also set your own profit target between both the prices.
Also check Nifty and Bank Nifty Market Prediction
THE SUPPORT
Hindi’s meaning of support is to support or help.
In the stock market, the word support is used in the technical analysis of the stock to describe that price point on the chart, from which the price point of a stock stops falling, that is, the price point from which the stock price stops falling and goes upwards.
That is, SUPPORT is such a price point in the technical chart of a stock, which prevents the price of the stock from falling further, or SUPPORT to prevent further fall.
With the SUPPORT PRICE POINT, there is a possibility of a further increase in the price of the stock.
Things to understand from the CONCEPT of SUPPORT
- The support Price is less than the current market price of a stock. There is a possibility of a bounce back in the price of the stock from the support price point, and the price of the stock can go upwards,
- From the support price point, we understand that – at this price point, traders have sold as much as they wanted to sell that stock, and now after the stock price comes to its previous support price point, due to the low price of that stock. Buyers will like it, and by buying Buyers, the price of that stock will start moving above the support price.
- With support, we get a signal of the possibility of a change in the Bearish trend and an increase in the stock price.
- Support Point tells us that if the price of a stock is falling down, then the price of that stock will fall only around its previous support price appearing on the chart, and instead of going down further from the previous support price, the price of the stock will bounce back and go upward,
- At the support price point of a stock, there is every possibility that the falling price of that stock will stop, and it may also happen that in the next few trading sessions, the stock price will move up.
- There is a possibility of the market going up from the Support Price Point, so we should think about buying at this point, and buy the stock at the Support Price Point,
- Sometimes when you do Short Selling, you have to buy the stock at a low price, then in such a case, you can close your Short Selling position by buying the stock around the Support Price Point.
THE RESISTANCE
The Hindi meaning of resistance is a hindrance, stopping from growing,
In the stock market, the word Resistance is used in the technical analysis of the stock to describe that price point on the chart, from which the price point of a stock stops from moving up, that is, the price point from which the stock The price stops moving up, goes down.
That is, resistance is a price point in the technical chart of a stock, which prevents the price of the stock from rising further, or resists going up further.
With the resistance price point, there is a possibility of bears coming further in the price of the stock.
Things to understand from the CONCEPT of RESISTANCE
- The resistance Price Point is higher than the current market price of a stock.
- From the resistance price point, there is a possibility of a down reversal in the price of the stock, and the price of the stock may come down,
- From the resistance price point, we understand that – at this price point, the trader has bought as much as he wanted to buy that stock, and now the stock price after coming to its previous resistance price point, due to the high price. People will like to sell that stock, and selling more of that stock will cause the price of that stock to fall below the resistance price point,
- From resistance, we get a signal of a change in the bullish trend and the possibility of a recession in the stock price,
- Resistance Point tells us that if the price of a stock is going up, then the price of that stock will start coming down from its previous resistance price point shown on the chart,
- From Resistance, we can go down by reversal instead of changing the bullish trend and going up and up from the previous Resistance Point,
- At the resistance price point of a stock, there is every possibility that the rising price of that stock will stop, and it may also happen that in the subsequent few trading sessions the price of the stock will be around its previous resistance price point price. keep going, and then go down,
- There is a possibility of the market going down from the resistance price point, so we should think about selling at this point, and sell the stock at the resistance price point,
- If you are looking for a short selling opportunity then by short selling at the Resistance price point, you can earn a profit later by buying at the Support Price Point,
- If you have bought a stock, and you want to make a profit by selling it, then you should sell your stock at the Resistance price point because from this price point the market can go back down, and you can miss the opportunity to sell,
- The resistance price point can be the target price in the long position of a transaction,
How to identify SUPPORT AND RESISTANCE on the Chart
There are 4 steps to identify support and resistance.
- Load Data Points on the chart
- Identify at least 3 price action zones that appear on the chart
- Align the Price Action Zone
- Draw at least 3 horizontal lines and trending lines
With the help of these four steps, you can easily and clearly identify support and resistance on the chart of a stock, let us now understand these four steps in detail.
1. Loading Data Points on the Chart (LOAD DATA POINTS)
By loading the data points on the chart, we mean how long we want to see the support and resistance, e.g. for intraday trading, a data point of a few days may be enough, while for swing trading a data point of a few weeks Points will be required, apart from this, if we are looking for long term investment opportunities and looking for long term support and resistance, then we need to chart data points for long term of 6 months, 1 year or more in the chart. have to load,
So to identify the support and resistance, it is to be kept in mind that when we load the data point, then the data point should be loaded in the chart according to the type and amount of time we want to take the trade.
For short-term trades – by short term means swing trading, and hence need to load data points ranging from a few weeks to 3 to 6 months, as you think fit,
For Long Term Trade – By Long Term means Long Term Investment, and for this, data of 12 to 18 or 24 months must be loaded, which you think is appropriate,
2. Identifying the four price action zones that appear on the chart (IDENTIFY AT LEAST 3 PRICE ACTION ZONE).
After the data is loaded on the chart for a suitable time frame, we have to identify some price action zones, there can be three things in the price action zone, and if any one of these three things is visible in the chart, then that Could be a price action zone – those three things
Such a place in the chart where the price goes down a bit stops for a while and does not go below any particular price, and the next few trading sessions continue in the same bottom range,
If something like this appears on the chart, it could be a price action zone of support,
Such a place in the chart where the price moves up a bit stops for a while and does not go above any particular price, and for the next few trading sessions the price of the stock continues to move in this top range, So if something like this appears on the chart, it could be a price action zone of resistance,
Such a place in the chart from where the price of a stock has a complete reversal, that is, at a particular price, the stock either goes down, or goes up, and then after going down or up, the next range of the same price Some trading sessions keep going on,
In this way, you can identify and circle the price action zone, so that you can keep in mind,
3. ALIGN THE PRICE ACTION ZONE
Now as soon as we have the price action zones, the next step is to join the similar price action zones with a straight line, which is called Align the Price Action Zone step,
While drawing the straight line of the Price Action Zone in this step, it should be kept in mind that there should be a sufficient time gap between the two Price Action Zones,
For example, if the first price action zone is in the first week of a month while matching the price action zone with the straight line on the 12-month chart, then the next price action zone should be at least at the end of the month,
Draw at least 3 horizontal lines (FIT A HORIZONTAL LINE)
By joining at least 3 price action zones with a straight line, we get a line of support or resistance,
Whatever the price action zone is, we just have to take into account the time frame and the gap so that there is enough gap between the two price action zones,
When we draw three horizontal lines, by this we do not know 100% confirmation of any trade, rather we can predict a better probability trade from such horizontal line.
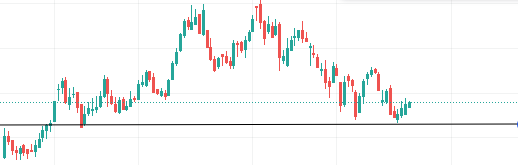
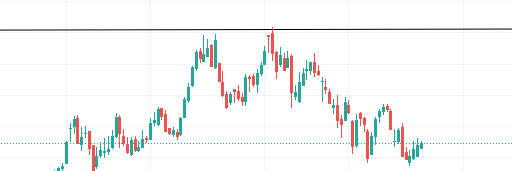
If any line is below the current market price in the chart, then it means it is a support line, and the price circled on this support line is called the support price,
If any line is above the current market price in the chart, then it means it is a resistance line, and the price circled on this resistance line is called the resistance price,
Now that we have found the straight, support line and resistance line, we can calculate the support price and resistance price of a stock with 1% variation from the price we get from this line.
To what extent can the SUPPORT AND RESISTANCE be trusted?
As we saw in the basic concept of technical analysis, no method can always work, and thus any pattern, whether it is a candlestick pattern or support and resistance, may not always be 100% accurate, and therefore support and resistance cannot be wholly relied upon, rather you should pay attention to other aspects of the stock along with using support and resistance
What is Psychology behind Support and Resistance?
SUPPORT AND RESISTANCE show human behavior.
Support and resistance on a chart try to explain the behavior of humans, and why at a price point some people get more and more attracted to that stock or keep their distance from it.
Support and resistance, like other facts of technical analysis, does not give 100% confirmation of a trade, but tries to tell that, a special kind of event, where people buy or sell a stock more and more. want, and because it is happening again and again, like the behavior of a human